Is the Usual El Nino Pacific Storm Track Being Pulled North by Arctic Warming?

Will El Niño soften the mid-latitude droughts?

GR: Scribbler is suggesting that weakening of the polar high-pressure air mass is drawing the jet stream and El Niño enriched storms farther north away from the U. S. Southwest. Thus, the three-month forecast in the map below, based on past El Niño activity, may be inaccurate.

The 2014 Mule Deer Fawn Twins

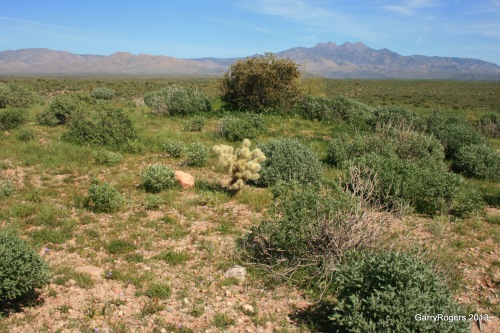
The 2014 Mule Deer Fawn Twins Sampling Fallen Seeds From the Bird Feeder.

Three years ago, deer began visiting Coldwater Farm for the first time in 20 years. This might be related to drying springs in the uplands brought on by drought and the water-table-lowering wells of the homes in the foothills. A basalt dyke forces the normally belowground flow of the Agua Fria River above ground as it crosses the farm. Besides continuous year-round flow, there are several spring-fed ponds. For the past few years, homeowners have deepened their wells, and the water level in the ponds has dropped by about 10%. Last year, some precipitation softened the drought, and upland springs are flowing again. Nevertheless, the deer have remained and have increased.

Scribbler and others believe that precipitation events in February should tell us if this El Niño will break the Southwest drought, or a poleward shift of the storms will leave it intact.

seasonal-outlook-noaa Polar Amplification vs a Godzilla El Nino — Is the Pacific Storm Track Being Shoved North by Arctic Warming?

From robertscribbler.com 

“It’s an El Niño year. One of the top three strongest El Ninos on record. The strongest by some NOAA measures. And we are certainly feeling its effects all over the world. From severe droughts in Southeast Asia, Africa, and South America, to Flooding in the Central and Eastern US, Southern Brazil, and India, these impacts, this year and last, have been extreme and wide-ranging. During recent days, Peru and Chile saw enormous ocean waves and high tides swamping coastlines. Record flooding and wave height events for some regions. All impacts related to both this powerful El Niño and the overall influence of human-forced warming by more than 1 C above 1880s temperatures on the whole of the hydrological cycle.

“Amped up by a global warming related 7 percent increase in atmospheric water vapor (and a related increase in evaporation and precipitation over the Earth’s surface), many of these El Niño related impacts have followed a roughly expected pattern (you can learn more about typical El Niño patterns and links to climate change related forcings in this excellent video by Dr Kevin Trenberth here). However, so far, some of the predicted kinds of events you’d typically see during a strong El Niño have not yet emerged. A circumstance that may also be related to the ongoing human-forced warming of the globe.”


Arctic Heatwave Drives Deadly Asian Cold Snap

GR: And more storms for Great Britain. The extreme events might soon outpace all (well, the few that care) reporters. Thank you Robert Scribbler.

robertscribbler's avatarrobertscribbler

In the Arctic today, there’s a warm wind howling over Siberia. It’s a wind blowing from the northwest. A wind originating from the Arctic Ocean. Siberia is warming up today because warm air blew in from the direction of the North Pole. This should strike everyone as ridiculously, insanely odd.

****

In Okinawa it snowed for the first time on record this weekend. In Taiwan, a cold snap turned deadly killing 85 as tens of thousands more huddled in homes that lacked any form of central heating. In South Korea, 500 flights were grounded due to unseasonable weather. In Hong Kong, the temperature was 3 C — the same temperature as a region near the southwestern coast of Svalbard east of Greenland and above the Arctic Circle.

What the hell is going on? In short, a global warming driven heat-up of the Arctic has punched a hole in the…

View original post 1,189 more words

The Human Hothouse Turns Bolivia’s Second Largest Lake into a Withered Wasteland

“Lake Poopo in Bolivia has dried up. And Climate Change has been named as the top cause of the disaster.

“After decades of drought and depressed rainfall related to a human-forced warming of the globe, the once-massive lake is now gone. Once measuring 90 by 32 kilometers and covering an area of over 1,000 square kilometers this second largest lake in all of Bolivia has turned into a dried out disaster zone. Cracked, baked earth, overturned and abandoned boats, and the desiccated remains of lake life are all that are left as sign to the fact that a giant lake once existed. The flamingos, fish and other wildlife that relied on the lake are now dead or long gone. Yet more lonely casualties of a climate changed radically by an incessant burning of fossil fuels.

(Human-forced climate change is implicated in Bolivia’s loss of Lake Poopo. Video source: TeleSUR English.)

Rainy Season Undone

About a decade ago, the rainy season in this region of the Altiplano Mountains began to dry up. Rainfall became less regular and the great Lake Poopo — important to locals for its supply of fish and wildlife — began to fade away. By 2015, record global temperatures and El Nino conditions had again pushed the rainy season back. By January of 2016, one month into the typical rainy season, no rains had yet fallen and the great lake had dried up completely.  From: robertscribbler.com

GR:  With the ongoing drought, there will be more of these events. In addition to the harm to wildlife, the peace and security of human groups is going to decline.

Warm Arctic Storms Aim to Unfreeze the North Pole Again — That’s 55 Degrees (F) Above Normal For January

GR: Losing the polar ice and high-pressure cap are unconscionable. I didn’t think we could, but now the possibility is real.

image

robertscribbler's avatarrobertscribbler

It’s worth re-stating. The Starks were wrong. Winter isn’t coming. Winter, as we know it, is dying. Dying one tenth of a degree of global oceanic and atmospheric warming at a time. Steadily dying with each ton of heat-trapping greenhouse gasses emitted through our vastly irresponsible and terrifyingly massive burning of fossil fuels.

******

According to UCAR reanalysis, it’s something that’s only happened three times during December in the entire temperature record for the North Pole since the late 1940s. Four times now that a record warm surge of air hit that highest point of Northern Hemisphere Latitude during late December of 2015. An event that was influenced by the very destructive Winter Storm Frank. A combination of weather variables that, by themselves, was odd and rare enough. But what may be about to happen next week is even more rare. Because we’ve never, not once, seen this…

View original post 693 more words

Vital Signs: Carbon Dioxide

Carbon dioxide (CO2) is an important heat-trapping (greenhouse) gas, which is released through human activities such as deforestation and burning fossil fuels, as well as natural processes such as respiration and volcanic eruptions. The first chart shows atmospheric CO2 levels in recent years, with average seasonal cycle removed. The second chart shows CO2 levels during the last three glacial cycles, as reconstructed from ice cores.

The time series below shows global distribution and variation of the concentration of mid-tropospheric carbon dioxide in parts per million (ppm). The overall color of the map shifts toward the red with advancing time due to the annual increase of CO2.  From: climate.nasa.gov

GR:  This is a good information source.

Snowshoe hares face climate change challenge

GR: I have run out of digits on which to count the ways that humans are destroying wildlife and its habitat.

Snowshoe_hare_transitional_coloring

Bob Berwyn's avatarSummit County Citizens Voice

‘That mismatch does indeed kill’

Staff Report

For millennia, snowshoe hares have camouflaged themselves from predators by blending in with their surroundings, turning pure white in the winter to blend in with the snow, then brown in the summer.

But climate change is shifting the timing of the snow season, and the hares may not be able to adapt in time, according to a North Carolina State University study published in the journal Ecology Letters.

Based on field research with radio-collared snowshoe hares in Montana, mismatched snowshoe hares suffer a 7 percent drop in their weekly survival rate when snow comes late or leaves early and white hares stand out to predators like “light bulbs” against their snowless backgrounds.

View original post 309 more words

Climate Change and Wildfire

Wildfire Ecology

I’ve been interested in natural vegetation response to wildfire for more than 40 years. Most of my work involves the desert shrublands and woodlands of western North America. From the beginning of my studies, I saw that Asian weeds brought by European sheep and cattle herders had heavily infested native vegetation. It soon became clear that added fuel provided by the weeds was allowing fires to increase in size and number. During the past century and a half, the weeds have replaced vast areas of native shrublands and woodlands that could not contend with the increasing wildfires.

Fire-prone invasive plants fueled fires that converted this formerly diverse Sonoran Desert landscape of small trees and tall Saguaro cactus into an impoverished shrubland.

This is one of the study sites that Jeff Steele and I established in 1974.  Two fires (1974 and 1985), converted this formerly diverse Sonoran Desert landscape of small trees and tall Saguaro cactus into an impoverished shrubland.

Humans with their weeds and livestock led the first devastating wave of wildfire across the arid and semi-arid lands of the world. The next wave will come from human-caused global warming.

The following is from Global Warming Forecasts

[Click this link for my review of the Forecasts.  Below, I’ve include 2050 as an example of the forecasts.]

2050 Wildfires

“2050.  Forest wildfire burn area in the U.S. is projected to increase by over 50% and as much as 175% in some areas by 2050.  “The area of forest burnt by wildfires in the United States is set to increase by over 50% by 2050, according to research by climate scientists. The study [Impacts of climate change from 2000 to 2050 on wildfire activity and carbonaceous aerosol concentrations in the western United States], predicts that the worst affected areas will be the forests in the Pacific Northwest and the Rocky Mountains, where the area of forest destroyed by wildfire is predicted to increase by 78% and 175% respectively.

“The research is based on a conservative temperature increase of 1.6 degrees Celsius over the next 40 years [2010-2050]. Published in the Journal of Geophysical Research, scientists also say that the increase in wildfires will lead to significant deterioration of the air quality in the western United States due to greater presence of smoke. . . . This work was funded by the U.S. Environmental Protection Agency (EPA) and National Aeronautics and Space Administration. Dr. Dominick Spracklen carried out the research whilst at Harvard’s School of Engineering and Applied Sciences (SEAS) in collaboration with Jennifer Logan and Loretta Mickley.” (NASA press release, “Wildfires Set to Increase 50 Percent by 2050,” NASA Earth Observatory, Twitter NASA EO, Greenbelt, Maryland, July 28, 2009 reporting findings in D.V. Spracklen, L.J. Mickley, J.A. Logan, R.C. Hudman, R. Yevich, M.C. Flannigan, and A.L. Westerlin, “Impacts of climate change from 2000 to 2050 on wildfire activity and carbonaceous aerosol concentrations in the western United States,” Journal of Geophysical Research, Vol. 114, D20301, doi:10.1029/2008JD010966, published October 20, 2009.” Global Warming Forecasts

View Jennifer Logan’s PowerPoint presentation on wildfires.


A Blizzard Roars Out of Climate Change’s Heart — Polar Warming and A Record Hot Atlantic Ocean Brew Up Nightmare Storm for US East Coast

GR:  Here’s an informative article describing linkages between violent storms (the one on January 22-23, 2016 in particular) and human-caused global warming.  Good luck to everyone in this storm’s path.

robertscribbler's avatarrobertscribbler

There’s a historic blizzard in the form of Winter Storm Jonas setting its sights on the US East Coast. The storm is slowly coming together Thursday evening and now appears to be set to paralyze a 1,000 mile swath under 1 to 2.5 feet of snow even as it hurls a substantial storm surge and 40-60 mph winds at waterfront cities from Norfolk to Boston. A monster storm whose predicted formation has made headlines since Tuesday. But what you won’t hear most major news sources mention is the likelihood that this gathering storm has been dramatically impacted by a number of new climate features related to a human-forced warming of the globe.

Jonas Begins its Ocean-heat Fueled Rampage in Southeastern US

(Jonas begins its ocean-heat-fueled rampage on the evening of Thursday, January 21. Image source: NOAA.)

A Warming Arctic Shoves the Cold Air Out

To understand how climate change helped make Jonas so extreme, it’s best if…

View original post 1,282 more words

Global Warming Forecasts | #climatechange

Expert Global Warming Forecasts

GR:  This reference covers global warming forecasts that scientists have made for the years 2015, 2020, 2025, 2030, 2035, 2040, 2050, 2080, 2090, and 2100.  Projections by well-known scientists and peer-reviewed publications make this a dependable resource.  Reading it, you might be amazed that there has been so much doubt and so little action on global warming.

“The colors on the map show temperature changes over the past 22 years (1991-2012) compared to the 1901-1960 average for the contiguous U.S., and to the 1951-1980 average for Alaska and Hawai’i. The bars on the graph show the average temperature changes by decade for 1901-2012 (relative to the 1901-1960 average). The far right bar (2000s decade) includes 2011 and 2012. The period from 2001 to 2012 was warmer than any previous decade in every region.” (U.S. Global Change Research Program)

This map shows what has actually happened in the U. S. “The colors on the map show temperature changes over the past 22 years (1991-2012) compared to the 1901-1960 average for the contiguous U.S., and to the 1951-1980 average for Alaska and Hawaii. The bars on the graph show the average temperature changes by decade for 1901-2012 (relative to the 1901-1960 average). The far right bar (2000s decade) includes 2011 and 2012. The period from 2001 to 2012 was warmer than any previous decade in every region.” (U.S. Global Change Research Program)

The following is from the Global Warming Forecasts website.

“Global warming forecasts trace their history back to the works of Swedish chemist Svante Arrhenius (1890s), American geologist Thomas Chamberlain (1890s) and British engineer Guy S. Callendar (1930s and ’40s).

“In the 1950s, after oceanographers Roger Revelle and Hans Suess published research findings concluding that “human beings are now carrying out a large-scale geophysical experiment” by discharging greenhouse gases into the atmosphere, Revelle, director of the Scripps Institution of Oceanography, recruited geochemist Charles David Keeling to begin the process of taking long-term measurements of carbon dioxide (CO2) concentrations in the atmosphere.

“When Keeling started taking CO2 measurements at the weather observatory at the top of the Mauna Loa volcano in Hawaii and on the continent of Antarctica, he established the baseline for collecting the data that would begin the modern era of global warming forecasting.

“Since Revelle’s and Keeling’s landmark work in the 1950s, global warming forecast research has expanded to develop projections based on concentrations of other greenhouse gases such as methane (the principal component of natural gas), carbon monoxide and nitrous oxide as well as temperature data, precipitation, weather patterns and specific ecosystems.

“Global warming forecasting and research formats, however, have tended to be linear or vertical in nature, i.e., focusing on observations of singular data sets over time such as:

[GR:  These links take you to some excellent articles.]

“Similarly, projections of climate change impacts have tended to focus on specific sectors such as water resources, energy supplies, energy usage, transportation, human health, food, specific ecosystems, geographic regions, countries and continents.

“Here and on the pages that follow is a look at global warming forecasts from a “confluence forecast” or “convergence forecast” perspective. Rather than the conventional vertical format, we look at multiple converging forecasts presented in a horizontal or more integrated “side-by-side” context.” — http://www.global-warming-forecasts.com/